Border City Blues
It is no coincidence that the starkest reactions to police violence—from Ferguson to Baltimore—have flared in cities strung along the Mason-Dixon Line.
It is no coincidence that the starkest reactions to police violence—from Ferguson to Baltimore—have flared in cities strung along the Mason-Dixon Line.

The Justice Department report offers a glimpse of the systematically oppressive and petty policing in Ferguson. But in order to fully understand how racism became policy in the St. Louis suburbs, we need to look at the history of suburban development itself.
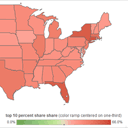
The “suspension bridge” of top income shares (based on the work of Thomas Piketty and colleagues) is by now a familiar icon of American inequality. In this rendering, top-end inequality (measured as the share of national income going to the …
Percentage of black residents in Ferguson, Missouri: 67 Of black police officers: 5.7 Percentage of traffic stops targeting black residents in Ferguson: 86 Of arrests: 93 Distance in miles from Ferguson to St. Louis suburb of Ladue: 10 Rank of …

Cities offer the natural solidarities of work and neighborhood that make sustained organizing possible. Their decline spells disaster for American labor.

What is remarkable in Ferguson is not just the way segregation has been sustained, but the way it maps so cleanly onto patterns of economic disadvantage.

Over the course of St. Louis’s history, local segregation was enforced by a tangle of public and private policies.

This month’s jobs report was widely celebrated for showing that—after adding 217,000 jobs in May 2014—the United States had finally returned to the December 2007 (pre-recession) level of employment. This is a useful comparative benchmark, underscoring the unusual depth and …

There is nothing novel about the impact of technology on labor markets. So why do so many pundits insist on blaming computers and robots for today’s inequality?

Thomas Piketty’s Capital in the Twenty-First Century merits ongoing praise for the renewed attention it has drawn to the challenge of American inequality. The decade of collaborative and comparative work on the trajectory of top incomes that it represents, as …

Over the past few weeks, the essays in the Our Inequality series have developed a historical explanation for our growing divide. The introduction discounted the importance of the “usual suspects” in this story: globalization, technology, and demography. (Because these trends …

Concluding our nine-part series on inequality, a crash course in the last 100 years of U.S. fiscal and monetary policy, from the creation of the Fed to the Phillips curve to the modern-day bloodletting known as austerity.

Between 1965 and 2000, CEO compensation grew by about 2500 percent, while worker compensation inched up only about 30 percent. This is a market malfunction, a democratic disaster, and a key driver of inequality, as the political currents that eroded the bargaining power of ordinary Americans have also buoyed the incentive and the opportunity of the richest 1 percent to pad their incomes.

It’s no secret by now that the recent spike in American inequality, and the gains rapidly accruing to the wealthy, are driven in large part by “financialization.” Over the last generation, financial services have expanded not with economic growth, but with stagnation and crisis—and their spectacular rise has accounted for about half of the decline in labor’s share of national income. How did things get this bad?

The tax system offers us a detailed and damning description of American inequality and, just as importantly, promises to do something about it. But the American system of public finance has always been weak and fragmented, and three decades’ worth of tax cuts haven’t helped.